Welcome to the relevant industries to call us, we will work together with you in good faith, common development! We sincerely welcome new and old friends to call us for guidance!
Our hand in hand, will be for your product to bring the deduction.

Internal short circuit (ISC) of lithium-ion batteries is an important factor that causes battery safety hazards. The causes of the battery's internal short circuit include impurities in the metal, lithium dendrites piercing the diaphragm, and problems in the battery manufacturing process. A short circuit inside the battery will promote high temperatures in special areas and the start of a series of exothermic side reactions, which may cause thermal runaway (TR). During the evolution of the battery's internal short circuit, the temperature change may be drastic or regional. Therefore, it is necessary to conduct a comprehensive study on the spatiotemporal temperature variation of the internal short circuit of the battery to improve the understanding of the ISC mechanism.
【Research content】
To study the mechanism of the battery's internal short circuit, The Institute of Advanced Structural Technology, Beijing Institute of Technology, together with the State Key Laboratory of Fire Science, University of Science and Technology of China, the State Key Laboratory of Automotive Safety and Energy, Tsinghua University, and the 21C Innovation Laboratory of Contemporary New Energy Technology Co., Ltd. proposed a new method for in situ characterization of the internal space temperature variation of soft pack batteries under the conditions of normal circulation and internal short circuit of batteries. By using a piece of BaF2 glass to achieve direct thermal imaging of the negative electrode material, the author uses high frequency wide temperature infrared imaging technology to capture the rapid evolution process of the short circuit inside the battery, analyzes the types of short circuit inside the battery and the factors affecting the battery power, reveals the evolution process of ISC, and summarizes the main requirements of ISC triggering thermal runaway. In addition, the authors evaluated the residues from the ISC cells and investigated changes in the membranes and electrodes.
【Content details】
1. Battery test set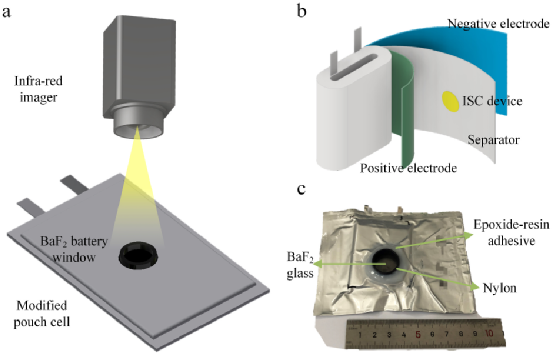 Figure 1.(a) Internal temperature infrared imaging and (b)ISC battery schematic. (c) A photo of the real battery, showing the structure of the BaF2 battery window.
The sample battery used in this paper is improved by a soft pack battery with a nominal capacity of 1Ah. The battery uses LiCoO2 or LiNi0.8Co0.1Mn0.1O2 as the positive electrode, carbon as the negative electrode, and a layer of PE as the diaphragm. The electrolyte is 1M LiPF6 1:2:1 EC:DMC:EMC (LiCoO2) /1:1 EC:DMC (LiNi0.8Co0.1Mn0.1O2). The difference between an ISC test battery and a normal battery is that the test battery has a BaF2 battery window and/or a wax - and magnetic-based ISC device (shown in Figures 1a and 1b, respectively).
2.Thermal imaging of batteries at different charge and discharge rates
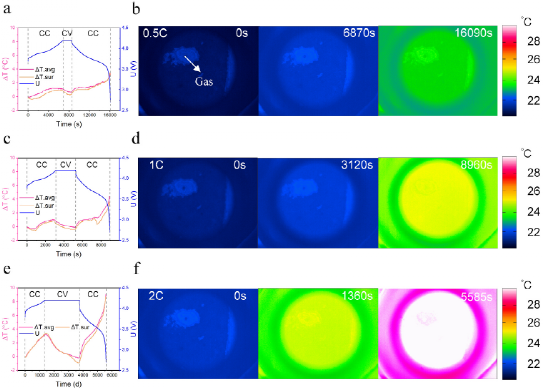
FIG. 2. Voltage, surface and electrode average temperature of the battery during constant current and constant voltage charging at (a)0.5C, (c)1C and (e)2C, as well as constant discharge; (b) Thermal images at the end of constant current charge and the end of constant discharge at 0.5C, (d)1C and (f)2C.
To verify the effectiveness of BaF2 glass in capturing the internal temperature of the battery, the authors tested the performance of the battery at different cycle rates. Figure 2 shows the voltage, surface, and electrode average temperature of the battery during constant current and constant voltage charging at 0.5C, 1C, and 2C, as well as during constant discharge. The battery has a capacity of about 1Ah and was naturally cooled during the test. As shown in FIG. 2a, c and e, the comparison of charging and discharging processes at different rates indicates that a higher constant current charging and discharging rate contributes to a higher temperature rise. In addition, the authors also found that the temperature rise during constant current discharge is more significant than that during constant current charging. During constant voltage charging, the temperature drops because the heat emitted by natural cooling is higher than the heat generated. As shown in Figure 2b, d, and f, the infrared imager displays a uniform electrode temperature with a maximum temperature difference of less than 1°C. During most of these tests, the average electrode temperature was slightly higher than the surface temperature. The average electrode temperature is more representative of the operating temperature of the battery than the surface temperature, because the thermocouple measures the temperature of the aluminum-plastic composite film rather than the temperature of the electrode. Therefore, the method using the BaF2 window can effectively characterize the internal thermal response of the battery under normal cycle conditions.
3. Analysis of influencing factors of internal short circuit
Table 1. Summary data for testing ISC batteries

To investigate the causes of internal short circuits in batteries, the authors assembled seven LiCoO2 batteries containing ISC devices and BaF2 battery Windows for ISC failure testing. The details of the seven ISC units are shown in Table 1. In the failure test, all seven batteries suffered from ISC, but the cause of ISC failure was different for different types of batteries. The authors suspect that this may be due to differences in ISC resistance caused by different pressures and contact areas, resulting in differences in temperature and voltage curves. The authors selected batteries from TR.1, ISC.1, ISC.2, and ISC.3 to study common features. The ISC results of the three batteries are shown in Figure 3a, b, and c respectively.
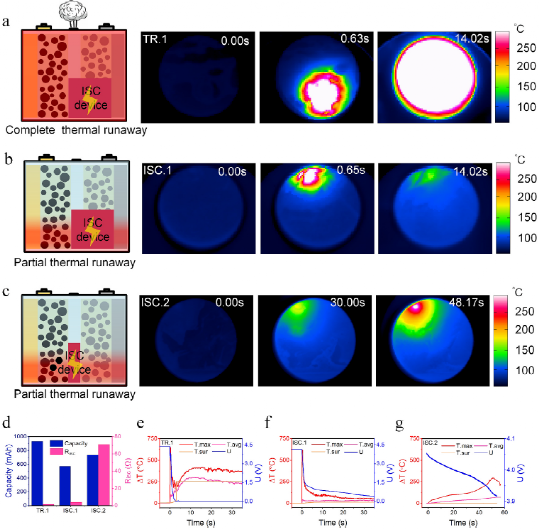
FIG. 3. Infrared images of ISC processes of samples (a)TR.1, (b)ISC.1 and (c)ISC.2; (d) A comparison of the estimated ISC resistance and capacity of the three test cells; (e) ISC.1, (f) ISC.2, and (g)TR.1 Illustration of maximum, average, and surface temperatures and battery voltage.
For the TR.1 battery, complete thermal runaway, violent combustion occurred. However, both ISC.1 and ISC.2 batteries suffer from partial thermal runaway, producing small amounts of gas. In this paper, battery energy and ISC resistance are studied to reveal their effects on the behavior of post-ISC cells.
(1) Battery power
Battery power is related to state of charge (SOC) and capacity. The batteries TR.1 and ISC.1 have an estimated capacity of 1Ah, while the ISC.2 has a capacity of about 800 mAh. Therefore, the authors chose TR.1 and ISC.1 batteries to investigate the influencing factors of battery power. Figure 3d depicts the ISC capacity and estimated ISC resistance. The ISC.1 battery discharge reaches an SOC of about 0.6, and when the ISC is triggered by TR.1, the SOC of the battery is about 1.0. Figures 3a and b provide schematic and thermal images of TR.1 and ISC.1 batteries, respectively. The authors first demonstrate their ISC type and severity. Thermal images are provided in chronological order. Before the ISC starts (set to 0.00s), the temperature distribution is almost uniform. The TR.1 and ISC.1 batteries will show hot spots of different sizes about 0.6 seconds after the ISC starts. Compared to ISC.1, the higher the voltage of the TR.1 battery, the more heat is generated, so the TR.1 battery hot spot size is larger. The TR.1 battery then suffers from TR, while the ISC.1 battery gradually cools. Figures 3e and 3f depict the temperature and voltage curves of the TR.1 and ISC.1 cells. Both test cells quickly reached a maximum temperature rise of about 650°C. This phenomenon shows that battery power is not the main factor affecting the maximum temperature of the ISC. In addition, the maximum internal temperature is not decisive for the battery to suffer complete thermal runaway.
After the ISC starts, the mean temperature difference of the battery TR.1 rises to 97.34°C at 0.37s, as shown in Figure 3e. It then continues to rise to 288.6°C at 8.12 seconds. The surface temperature difference gradually rose to 33.09℃ at 3.07s, and then rose sharply to 255.2℃ at 3.28s. The maximum value is limited by the measuring device. For ISC.1 cells, the mean temperature difference has a small peak of 68°C at 0.39s, then slowly rises from 55.09°C (1.04s) to 62.58°C (30.07s), while the surface temperature difference increases from 44.70°C (at 0.00s) to 57.3°C (at 30.03s). Rapid average and surface temperature increases can be used as indicators of complete thermal runaway occurrence. However, monitoring average or surface temperatures is not enough to predict thermal runaway, as they cannot detect regional hot spots that remain dangerous for high-capacity batteries.
In terms of voltage, both the TR.1 and ISC.1 batteries have a sudden drop at the beginning of an internal short circuit, similar to a high-power discharge. For the TR.1 battery, the voltage reaches 0 V 2 seconds after the ISC starts. In contrast, the ISC.1 battery does not drop to 0 V as fast as the TR.1 battery. 2 seconds after ISC starts, the voltage slope becomes smaller. Both test cells reached their maximum voltage drop rate at the start of the ISC. A comparison of voltage curves and thermal images showed that a rapid drop in voltage to 0 V meant that thermal runaway had spread throughout the battery. The results of TR.1 and ISC.1 show that high electrical energy leads to large areas of hot spots, so it is easy to occur thermal runaway.
(2) Internal short-circuit resistance
As shown in Figure 3c, the ISC.2 battery has a Ca-An ISC, so the ISC is more resistive than TR.1 and ISC.1 batteries with Al-An ISC. Compared to ISC.1 batteries, ISC.2 batteries are subjected to ISC for a relatively long time, as shown in Figure 3g. The hotspots of ISC.2 batteries expand slowly, unlike the rapid process of TR.1 and ISC.1 batteries, as shown in Figures 3a, b, and c. Although the ISC.2 battery has a larger capacity than the ISC.1 battery, as shown in Figure 2d, the ISC.2 battery has a smaller hot spot size and a lower temperature, indicating that the ISC resistance is more dominant in the hot spot diffusion process than the battery power.
As shown in Figure 3g, the ISC.2 battery reaches a peak maximum temperature difference of 293.76°C about 50 seconds after the start of ISC. Compared with other Ca-An results, the maximum temperature of ISC.2 has a sharp peak, while the curve of ISC.4 and ISC.5 is smooth, indicating that the exothermic reaction in the region becomes intense. The low ISC resistance of ISC.2 creates different hot spots compared to ISC.3 and ISC.4, eventually leading to violent regional exothermic reactions. As shown in Figure 3c, the hot spot formed by ISC slowly expands. Figure 3g depicts the temperature and voltage curves of the ISC.2 battery. The maximum temperature rises sharply at the beginning of ISC. The temperature rise slowed and then gradually increased. After reaching the maximum temperature difference peak, the temperature difference decreases rapidly. However, when the temperature starts to drop, the voltage drops to 3.92 V, which is still high compared to the TR.1 and ISC.1 batteries. Because the voltage is still high and decreasing, the heat is still being generated, and the boundary conditions of the test battery have not changed. Thus, this phenomenon shows that after the maximum temperature difference peak, there is a decrease in heating, especially for exothermic side reactions such as electrolyte decomposition, reaction of positive or negative electrode with electrolyte, and decomposition and regeneration of SEI. In terms of voltage, the ISC.2 battery gradually dropped by about 0.15V in 60 seconds, which is quite different from the voltage curve of the TR.1 and ISC.1 batteries. The average temperature difference gradually increased, increasing to 70.91 ° C at 56.72 seconds, higher than the value of the ISC.1 battery. This indicates that a lower ISC resistance with a longer heat transfer period and a higher release of electrical energy has a greater TR probability. The surface temperature of the ISC.2 battery remains low throughout the ISC process. Natural cooling conditions and long internal short circuits result in a stable form of surface temperature difference. It turns out that BAF2-based thermal imaging can capture the true battery behavior of ISCs that surface temperature measurements might miss.
(3) The dynamic process of internal short circuit causing thermal runaway
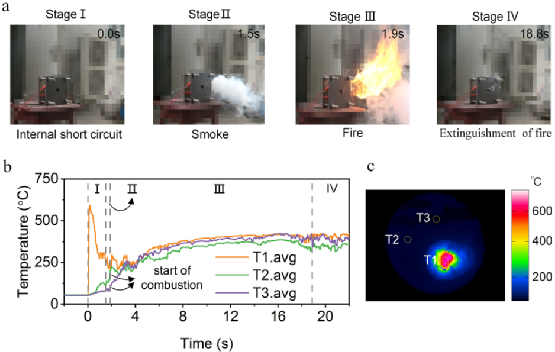
Figure 4. (a) Dynamic behavior process of battery TR.1; (b) Average temperature curves for different regions of the cell; (c) Temperature zone distribution for T1, T2 and T3.
The TR.1 battery undergoes a full TR, providing timing for the ISC triggered TR. The process is divided into four stages, as shown in Figure 4a.
In the first stage, ISC is triggered in 0.0 seconds. The battery had a slight exhaust at first, but it began to become violent at 1.5s from the second stage. In the third stage, the fire started at 1.9 seconds. In the fourth stage, the fire is slowly extinguished by gas from the front hole. From the first stage to the third stage, only 1.9s. This means that for similar ISC conditions, the evolution process from ISC to TR will be rapid. It is difficult to take active countermeasures to suppress smoke exhaust and combustion in such a short time.
The average temperature of different measurement areas is shown in Figure 4b. The average temperature selection of the three circular measuring areas is shown in Figure 4c. T1.avg provides a curve similar to the maximum temperature. In the first stage, T1.avg peaks and then drops to about 308.98°C, while T2.avg and T3.avg gradually rise to 118.89°C and 87.89°C before the gas runs out. In the second stage, the temperature of T2.avg and T3.avg changed little, while T1.avg suddenly dropped to 236.48℃ at 1.88s. At the beginning of the third stage, T2.avg and T3.avg rapidly increased to temperatures close to T1.avg, suggesting that the heat of combustion may be the reason for the temperature merger in such a short time. Then the temperature of the three regions continued to rise during the combustion process. In the fourth stage, as the fire is extinguished, the temperature begins to drop. As a result, when a hot spot of sufficient size reaches an unsafe temperature, the battery may suffer from TR, resulting in further emissions of combustible gases and their combustion. The energy released by the ISC is crucial for triggering the TR in similar situations.
(4) Observe complete thermal runaway caused by internal short circuit
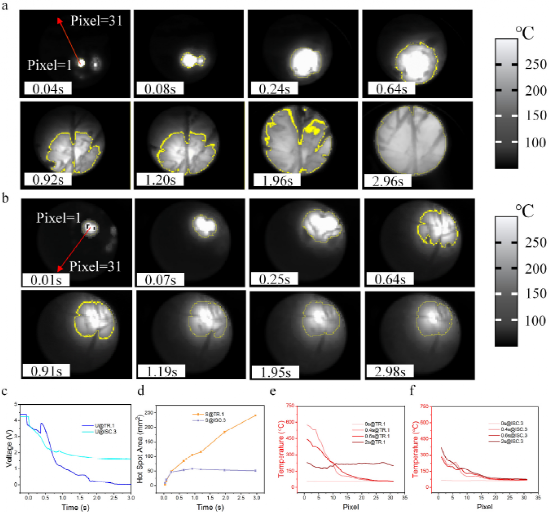
Figure 5. (a) TR.1 battery; (b) Thermal profile of the ISC.3 cell for defining temperature gradient measurement lines and selecting temperature zones above 150°C; Comparison of (c) voltage curves and (d) hot spots of TR.1 and ISC.3 batteries; Research on temperature gradients of TR.1 and ISC.3 batteries.
The comparison of TR.1 and ISC.3 cells reveals the mechanism by which ISC causes complete TR. Figures 5a and 5b depict the ISC evolution of batteries TR.1 and ISC.3. Because PE membranes melt at temperatures above 150°C, this transition is critical for ISC expansion and resistance reduction, and can even trigger side reactions and TR. Therefore, the authors chose temperatures above 150°C as the boundary of the hot spot, with the boundary drawn by the yellow line. From 0 (ISC start) to 0.64 seconds, the hot spots of both cells extend to similar values. During this time, the voltage drops rapidly, as shown in Figure 4c. The author believes that joule heat of internal short circuit is dominant in the heating of this period. As shown in Figures 4a, b, and d, the turning point for the TR of the TR.1 and ISC.3 batteries occurs in about 0.4 seconds. From 0.64s to 2.96s, the hot spot of the battery TR.1 extends across the entire BaF2 window, while the size of the battery ISC.3 is almost the same. Figure 4d clearly shows that the hot spot area of the ISC.3 battery is limited to about 50 square millimeters. This value can be used as a marker for the start of ISC simulation of thermal runaway. As shown in Figure 3a, since the TR.1 battery burns in 1.9 seconds, the slope of hotspot region expansion is stable. This suggests that exothermic side reactions in the BaF2 window region dominate between 0.64 and 2.96 seconds. The lack of oxygen limits the heat production of combustion.
Figure 5e and 5f describe the temperature gradients for TR.1 and ISC.3, respectively. After the ISC starts at 0.4s, hot spots in battery TR.1 are more severe than in battery ISC.3. The temperature of the region near the ISC point of the battery TR.1 decreased from 0.4s to 2.0s, while the temperature of the battery ISC.3 gradually increased. This suggests that severe hot spots contribute to a rapid exothermic side reaction within 2 seconds. In addition to the 50 square millimeter hot spot area, the severity of the hot spot is also critical for the occurrence of complete thermal runaway. It is quantified in Figure 4e and can be used as a reference for the LiCoO2 cell ISC analog thermal runaway trigger standard.
(5) Diaphragm and electrode residues
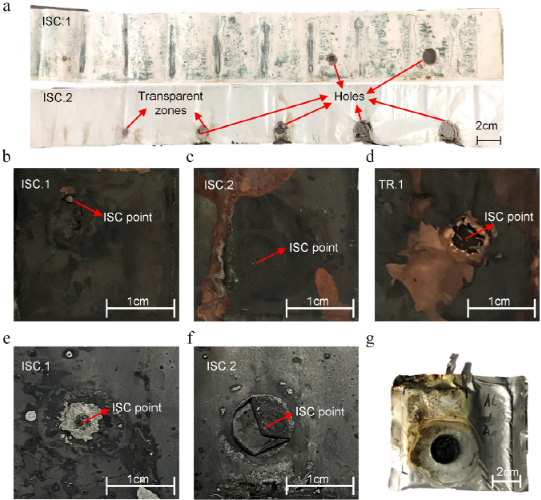
Figure 6. (a) Membrane residue of cells ISC.1 and ISC.2. (b) Illustration of the positive battery electrode around the ISC starting point after the ISC process of ISC. (c) ISC.2 and (d) TR.1 and the negative electrode of (e) ISC.1 and (f) ISC.2. (g) Real battery TR.1 after ISC and TR processes.
Two complete diaphragms for batteries ISC.1 and ISC.2 are shown in Figure 6a for studying the melting of the diaphragms. For ISC.1 cells, the diaphragm melts and forms two holes. The hole near ISC point is much larger than the other one. For the ISC.2 cell, four penetration holes and two transparent regions were observed on the diaphragm. The hole gets smaller as the distance from the ISC point increases. The transparent region indicates that the regional temperature is not enough to complete the melting of the two layers of diaphragm. As shown in Table 1, ISC.1 and ISC.2 batteries have different ISC types and different ISC resistances. In addition, the partial TR duration of the ISC.1 battery is very short, but the ISC.2 battery has a longer time. The change in the number of holes and the size of holes in the cell ISC.2 helps to reduce the ISC resistance by expanding the contact area of the anode and cathode compared to the cell ISC.1. This phenomenon indicates that the danger height of high or low ISC resistance depends on defect conditions. In addition, high ISC resistance can evolve into low ISC resistance as the contact area of the ISC expands several times over the initial conditions (Figure 6a).
Figures 6b, c, d, e, and f show the electrodes on the opposite side of the ISC starting. It is clear that for both ISC.1 and TR.1 batteries, holes appear in the copper collector fluid. However, for ISC.2 batteries, there are no holes, just damage to the electrode foil. This provides evidence for structural changes in the electrode at the beginning of ISC. In addition, the authors suspect that the large hole in the TR.1 battery is the cause of the voltage rebound (Figure 5c). Structural changes in the electrodes can represent the severity of the hot spot. As can be seen from Figure 6e, the positive electrode material of the ISC.1 battery reacts near the ISC starting point, exposing the aluminum collector fluid. For the cell ISC.2 as shown in Figure 6f, the positive material is curled. This provides support for exothermic side reactions in the positive electrode material around the ISC starting point. As shown in the thermal image in Figure 3, exothermic side reactions are violent in some areas where high temperatures are reached. The real battery TR.1 after ISC and TR processing is shown in Figure 6g. During the TR process of the TR.1 battery, gas is ejected from the laminated film around the positive lug, indicating that this part is most prone to rupture when the internal pressure is high.
【 Conclusion 】
The in situ thermal imaging method based on BaF2 cell window introduced in this paper can effectively characterize the spatiotemporal internal temperature of lithium-ion batteries under normal cycle or ISC conditions. Studies of ISC evolution show that after ISC start-up, batteries with high energy and low ISC resistance are prone to thermal runaway, with low energy batteries and high ISC resistance suffering temporary hot spots and gradually cooling to ambient temperature. In addition, due to voltage rebound, structural changes are also critical to the ISC process.
Qi Wu, Le Yang, Na Li, Yinqiang Chen, Qingsong Wang, Wei-Li Song, Xuning Feng, Yimin Wei, Hao-Sen Chen,In-situ thermography revealing the evolution of internal short circuit of lithium-ion batteries,Journal of Power Sources,Volume 540,2022,231602,ISSN 0378-7753.
https://doi.org/10.1016/j.jpowsour.2022.231602.
|
Last: Summary of the World Battery Congress
Next: What are the types of lithium-ion batteries? Let's see if it's what you think! |
Return |
Recommended news
On June 18, 2021, LG New Energy Asia Marketing General Manager revealed at the 2021 China Automotive Forum that LG New Energy is de…
Two-wheeled electric vehicles are a means of transportation in many Peoples Daily lives, but accidents are also common in the proce…